

A patient sits across from you in the consult room. Before you say a word, they already have a number in their head. They saw it on ClearChoice’s website. They read it on a forum. They heard it from a neighbor who had it done three states away.
That number is now your pricing benchmark, whether you set it or not.
This article is for practice owners, implant program directors, and treatment coordinators who are tired of guessing at pricing and ready to use a repeatable framework. Below you will find the real cost ranges patients compare, the competitive bands that work by market type, and the contribution margin math that separates practices with pricing confidence from those quietly giving away margin every month.
What patients typically see when researching full-arch implant costs:
| Treatment | Typical U.S. Range (2026) | Notes |
| All-on-4, per arch | $20,000 – $40,000 | Most quality practices target $25,000 – $30,000 |
| Both arches (full mouth) | $40,000 – $80,000 | Two-arch discounts common: $3,000-$8,000 off second arch |
| ClearChoice-style, per arch | $30,000 – $50,000 | Bundled; in-house lab; national brand premium |
| Most common reason for variation | Geography, materials, sedation, inclusions | “Starting at” pricing rarely reflects the all-in cost |
TL;DR: All-on-4 costs $20,000-$40,000 per arch in the U.S. (2026); most practices target $25,000-$30,000. ClearChoice anchors at $30,000-$50,000, 25-40% above local specialists. Profitable pricing starts with contribution margin modeling, not competitor copying. Below ~$25,000 per arch erodes margin and patient trust.
Last updated: March 2026
Why “All-on-4 Cost” Is a Pricing Conversation, Not Just a Number
The full-arch implant SERP is dominated by patient-facing cost guides, ClearChoice comparison pages, and “near me” queries. That is not a coincidence. The global dental implants market was valued at $5.56 billion in 2025 and is projected to reach $11.02 billion by 2033 at a CAGR of 9.02% (Grand View Research, 2025). As the market expands, so does the number of patients doing cost research before they ever pick up the phone.
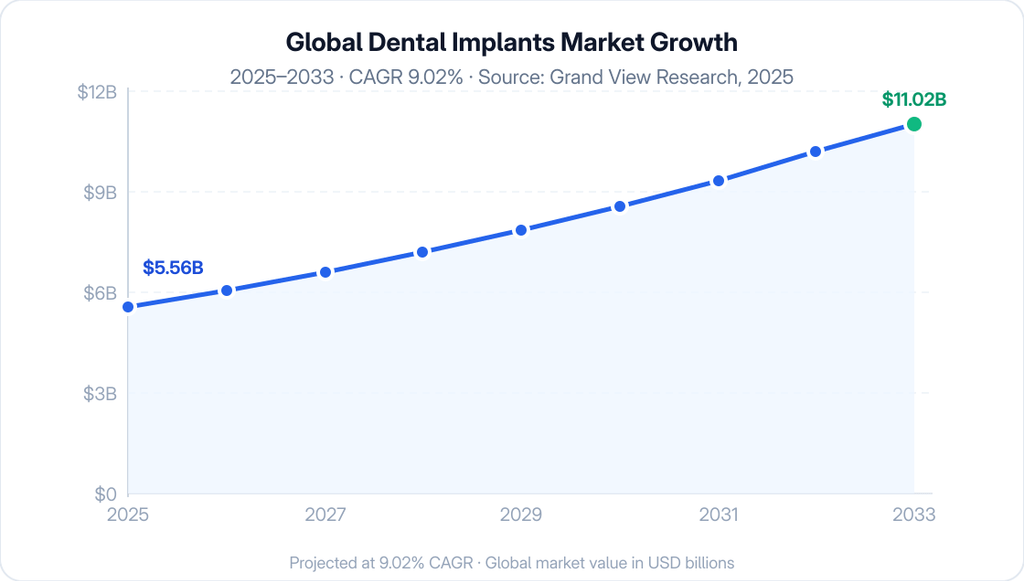
Global Dental Implants Market Growth — $5.56B (2025) to $11.02B (2033), CAGR 9.02%. Source: Grand View Research, 2025.
Here is the part most practices miss.
Patients asking “how much does All-on-4 cost” are rarely asking about the procedure.
They are asking three different questions at once:
- “Can I afford this?”
- “Is this practice trustworthy enough to spend this much with?”
- “How do I know I am not overpaying?”
Your pricing is not just a transaction number. It is a signal about your clinical standards, your systems, and the experience patients can expect. This creates what looks like a paradox but is not: underpricing harms trust. Overpricing without a clear value explanation kills acceptance. Both destroy revenue. The framework below resolves it.
Why this matters: Patients who perceive a price as “too low” regularly raise the question on the call or in the consult. A price that does not match their mental model of what quality full-arch care costs triggers doubt, not gratitude.
Real-World Cost Ranges and What Patients Compare You To
Full-arch implant costs in the U.S. currently range from $20,000 to $40,000 per arch depending on geography, material selection, and what is included in the bundle. The wide range is not a flaw in the market; it reflects legitimate differences in clinical scope, materials, and support systems. The problem arises when practices price without understanding what their competition is actually promising.
Per-Arch vs. Full-Mouth: Don’t confuse your patients!
Per arch means one jaw (upper or lower) treated independently.
Both arches (full mouth) means the complete restoration. “Starting at” language almost always refers to a single arch and rarely includes imaging, sedation, temporaries, and follow-up.
Three terms every treatment coordinator must use correctly from the first phone call:
- Per arch: One jaw, four implants, one prosthesis
- Both arches: Full mouth; two procedures, often bundled with a discount
- All-in price: Total cost including imaging, sedation, temporaries, finals, and warranty
When these are blurred on the phone or in the consult, price objections multiply. Clarity is not generosity. It is a show-rate tool.
ClearChoice-Style Anchoring: What Patients Benchmark Against
ClearChoice operates with a per-arch price range of approximately $30,000-$50,000, reflecting their bundled in-house lab model, national marketing, and same-day surgery positioning. Independent practices with equal or superior clinical systems typically price 25-40% below ClearChoice while delivering comparable, and often better, outcomes.
Insight: ClearChoice’s pricing is not a problem for independent practices. It is an anchor. Every patient who sees ClearChoice’s $30,000-$50,000 range before calling you arrives with an upward-calibrated price expectation. If you price at $27,000 and explain your value clearly, you are not losing on price. You are winning on value. The national brand has set your comparison floor.
“Near Me” Pricing Differences: What Really Drives Them
Geography is the largest single driver of price variation. Major metropolitan areas carry a 20-50% premium over smaller markets, driven by higher real estate, lab costs, staffing rates, and advertising competition. A $27,000 per-arch price in a secondary Florida market may require $31,000 to deliver the same margin in a high-cost urban market.
The five drivers of “near me” pricing variation:
- Geography and overhead: Rent, staffing, and lab costs by region
- Ad market competition: More implant centers competing raises cost per lead and required CAC spread
- Material selection: Acrylic adds $8,000-$12,000 per arch; zirconia adds $15,000-$25,000 per arch in lab cost
- Sedation model: IV sedation adds clinical cost and regulatory overhead
- Provider density: More specialists compress price; fewer enable premium positioning
Table 1: Offer Types Patients Compare
| Provider Type | Typical Promise | What’s Included | Typical Price Position | Risk If You Compete Only on Price |
| National brand (ClearChoice) | Same-day surgery, in-house lab | Comprehensive bundle: imaging, temps, finals | $30K-$50K per arch | Patient expects same-day; timeline differences create objections |
| High-volume implant center | Volume efficiency, lower cost | Variable; always confirm inclusions | $18K-$26K per arch | Often acrylic only; limited warranty; high volume = less chair time |
| Specialist-led local practice | Clinical expertise, outcomes | Often premium materials + long follow-up | $28K-$35K per arch | Premium price requires active value communication |
| GP with implant program | Convenience, continuity of care | Variable; depends on TC model and systems | $22K-$30K per arch | Must compete on relationship, not price alone |
| Dental tourism | Low cost | Varies significantly; follow-up typically excluded | $3K-$7K per arch (outside U.S.) | Patient still needs local follow-up; risk transfer to provider |
Why Underpricing Full-Arch Hurts Growth and Patient Trust
Low-price signals do not communicate generosity. They communicate risk. When a patient sees a $16,000 full-arch price next to a $27,000 option, the immediate internal question is not “great deal.” It is “what are they cutting?”
This is not theoretical. Research on price-quality relationships in high-involvement healthcare decisions consistently shows patients use price as a proxy for clinical safety and outcomes when they cannot directly evaluate technical skill (ADA Health Policy Institute). Full-arch treatment, a $25,000+ irreversible surgical procedure, is among the highest-involvement decisions a consumer will ever make. Price signals matter disproportionately.
The operational definition of “too low”:
Your current full-arch price is too low if it does not reliably fund quality materials, experienced staff, consistent marketing investment, and a follow-up protocol that protects your outcomes. If it does not fund these, the price is not competitive. It is unsustainable.
Insight: The practice that cuts to $18,000 per arch does not win more of the right patients. It attracts the most price-sensitive segment, the group least likely to value your differentiation, most likely to demand further discounts, and most likely to produce poorer outcomes due to compliance gaps. Low-price positioning is a self-selecting patient acquisition strategy with compounding margin damage.
Checklist: Signs Your Full-Arch Price Is Too Low
- You are consistently losing cases to price objections despite quoting below perceived competitors
- Your treatment coordinators regularly apologize for or justify the price during the consult
- You cannot fund consistent paid advertising from implant case revenue alone
- Lab fees represent more than 20% of your per-arch revenue
- You are using acrylic prosthetics not by clinical choice, but to make the price work
- Your post-treatment follow-up protocol has been shortened or eliminated to reduce overhead
- You have not increased your price in 18+ months despite rising lab and material costs
- Patients who book at your current price frequently ask for payment extensions or renegotiate before treatment
- Your TC conversion rate is above 60%, which may indicate you are priced below market, not that your TC is exceptional
- Team compensation has been compressed to maintain the current price point
How to Know What’s Competitive in Your Market Without Copying Competitors
The fastest pricing mistake in implant dentistry is setting your price by looking at a competitor’s website.
Their website price is a marketing number. It may be a “starting at” figure. It may exclude sedation, imaging, or temporaries. It may reflect a lab partnership you cannot access. Matching it without understanding what it includes guarantees a mismatched offer.
Identify Who Are Your True Competitors!
Not every practice with an implant page is a real competitor. Your actual competitors are:
- High-volume implant-focused centers: 10+ full-arch cases per month, dedicated TC, active paid advertising
- National brand clinics: ClearChoice and equivalents; these anchor patient expectations regardless of whether patients book there
- Established local implant-focused practices: 3-5+ years of consistent volume, visible in search and reviews
- Specialist-led programs: Oral surgeons or prosthodontists with implant-specific positioning
Ignore the GP who placed three implants last year. Do not benchmark against a discount clinic targeting a different patient segment. Focus on the practices competing for the same patient.
Build a Local Benchmark Sheet in 60 Minutes
The goal is not to copy prices. It is to understand offer structures.
- Identify 5-10 practices in your market (20-30 mile radius, or your advertising coverage area)
- Call each as a prospective patient, or have a team member do so
- Capture for each: quoted price, inclusions (imaging? sedation? temps? finals? warranty?), timeline, payment options, and how the price is presented
- Note what they say about materials and the clinical team
- Flag any “starting at” language and probe for all-in cost
This exercise takes under one hour and typically reveals a $5,000-$12,000 range among local competitors. More importantly, it reveals what most are not saying on the phone, which is where your differentiation lives.
Compare Offer Structure, Not Sticker Price
A $26,000 all-in price that includes zirconia finals, IV sedation, and a five-year warranty is not the same offer as a $26,000 “starting at” price that requires $4,000 in add-ons.
When benchmarking, compare: materials (acrylic vs. hybrid vs. zirconia), sedation (included vs. add-on), temporary prosthesis (included vs. extra), follow-up visits included, and warranty scope. Almost no competitor comparison is truly apples-to-apples. The practice that explains this to patients first wins the trust advantage.
Table 2: Local Competitor Benchmark Worksheet (Copy and Complete)
| Practice | Quoted Price | Arch(es) | Includes Imaging? | Includes Sedation? | Includes Temps? | Material | Warranty | Notes |
| [Practice A] | ||||||||
| [Practice B] | ||||||||
| [Practice C] | ||||||||
| [Practice D] | ||||||||
| [Practice E] |
Competitive Pricing Guidelines by Market Type
Based on TIE’s work with full-arch practices across the U.S., the following ranges represent strategic positioning targets, not industry-standard pricing. The right number for your practice depends on your overhead, lab relationships, competitive set, and value positioning.
Compliance note: The figures below are frameworks, not fixed benchmarks. Set your price based on your cost structure, market research, and contribution margin targets. Nothing here should be construed as pricing coordination.
Table 3: Pricing Targets by Market Type
| Market Type | Suggested Per-Arch Target | What Must Be True | Messaging Angle |
| Highly competitive metro (3+ active competitors, national brand presence) | ~$25,000 | Strong offer structure: IV sedation included, temps included, clear warranty, active paid media | “Better value than national brands, with a specialist team you can reach directly” |
| Suburban/mixed market (1-2 competitors, moderate ad competition) | $26,000-$29,000 | Differentiated materials pathway, documented outcomes, active referral program | “Local expertise, premium systems, without the national brand markup” |
| Secondary market or specialist-led (limited competition, specialist credential) | $30,000-$35,000+ | Specialist involvement, advanced planning (CBCT + guided surgery), documented long-term outcomes | “Specialist-led, data-backed, with outcomes you can verify” |
| National brand anchor (ClearChoice and equivalents, for reference) | $30,000-$50,000 | In-house lab, same-day surgery, national brand recognition | N/A; understanding their pricing informs your positioning |
Key insight: In most markets, pricing below approximately $25,000 per arch is not necessary to be competitive if your offer structure is clear and your systems are strong. The practices that undercut $25,000 are typically competing on price because they cannot compete on positioning.
The Danger of Pricing Based Solely on Competitors
Copying a competitor’s price without understanding their offer structure leaves you in a permanently reactive position. Worse, it creates patient confusion. When you match a competitor’s number, you are implicitly saying your offer is equivalent. If it is not, and if your materials, warranty, sedation model, or follow-up protocol are different, the patient has no framework to evaluate the difference.
This is not a pricing problem. It is a positioning problem.
The three proof pillars required to hold a price above the market midpoint:
- Clinical proof: Volume, outcomes data, specialist involvement, or advanced planning technology (guided surgery, digital workflow, CBCT). Patients cannot evaluate clinical competence directly, but they can evaluate the signals you provide.
- Experience proof: The consultation experience, the clarity of communication, the warmth and competence of your team, and the specificity of your treatment roadmap. “Here is exactly what happens between your consult and your final restoration” is more persuasive than any price justification.
- Social proof: Documented case outcomes (with patient permission), before-and-after galleries, verified reviews, and volume references. “We have placed over 400 full-arch restorations” is a statement patients can weigh.
Quick rule: If you charge above the market midpoint, you must demonstrate more. Not claim it. Demonstrate it at every patient touchpoint before and during the consult.
What Actually Justifies a Higher Full-Arch Price, and How to Prove It
Full-arch implants carry a 10-year prosthetic survival rate of 98.8% in the mandible (Nobel Biocare, citing Malo et al., PubMed, 2024). That outcome depends on implant system quality, surgical precision, prosthodontic execution, and follow-up protocol. Premium pricing is only defensible when these inputs are present, and actively communicated.
Clinical Differentiators
- Case volume and documented outcomes: A practice placing 50+ full-arch cases per year has a different risk profile than one placing five. Volume enables refinement. Reference it specifically.
- Specialist involvement: An oral surgeon and prosthodontist team commands a clinical premium. A GP with advanced training and a strong lab relationship can approach this, but must document it.
- Advanced planning and guided surgery: Computer-guided implant placement (Nobel Guide, Yomi robotics, or equivalent) reduces surgical variability and is a differentiator patients understand without needing clinical training.
Materials and Lab Pathway
The prosthetic material is the single largest driver of price variation beyond implant hardware:
- Acrylic/PMMA: Lower cost ($8,000-$12,000 per arch in material and lab fees). Functional. Standard for many high-volume programs.
- Hybrid (metal-reinforced acrylic): Mid-tier durability; better esthetics than basic acrylic.
- Monolithic zirconia: Premium material adding $15,000-$25,000+ in lab costs per arch. Harder, more esthetic, longer expected longevity. The correct justification for a $30,000+ price point.
Patients understand the temp-to-final roadmap when it is explained clearly. “You receive a full set of temporary teeth at surgery. At your six-month review, we transition to your final zirconia restoration” creates trust and justifies a premium.
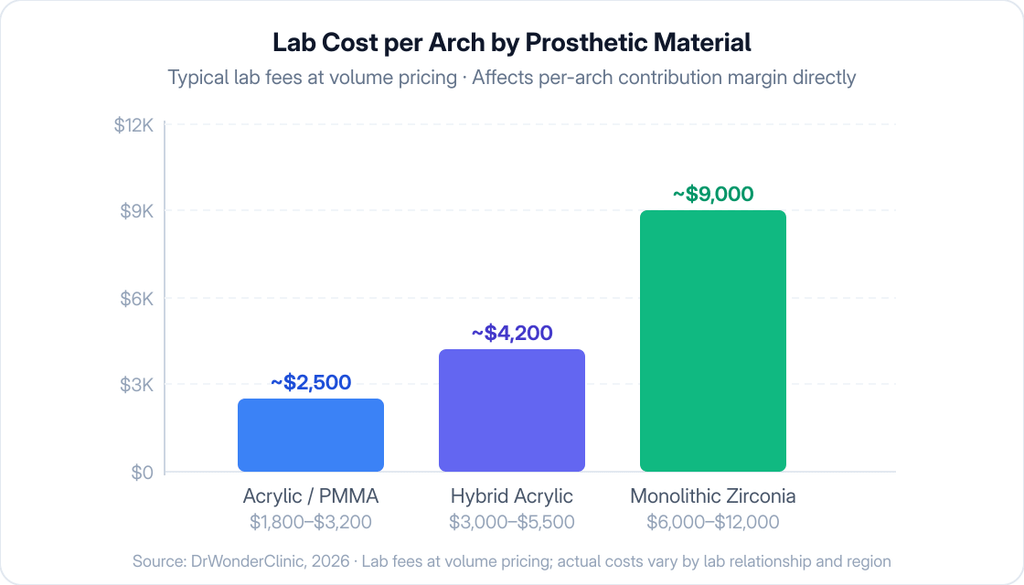
Lab Cost per Arch by Prosthetic Material. Acrylic ~$2,500 · Hybrid ~$4,200 · Zirconia ~$9,000.
Experience Differentiators
Patients are not buying implants. They are buying the experience of going from broken or missing teeth to a full, confident smile, and most are terrified of the process. The practices that command $30,000+ per arch without resistance are not always the most clinically advanced. They are the ones whose team makes the process feel inevitable and safe.
Experience differentiators that justify a higher price:
- Single-point-of-contact coordination from inquiry to final restoration
- Reduced visit count (surgery and temps on day one)
- IV sedation comfort and recovery support included, not add-on
- Formal post-operative follow-up schedule with defined touchpoints
- Written warranty with clear, specific terms, not “we will take care of you”
The Economics: Price for Contribution Margin, Not Fear
Contribution margin is the number that determines whether your implant program is building your practice or quietly subsidizing it. The formula is straightforward.
Contribution Margin: Definition and Formula
Contribution Margin = Revenue per Arch − Variable Costs per Arch
Variable costs include lab fees (largest lever), implant hardware, surgical supplies, sedation materials, and your cost per acquired case (CAC). Fixed costs (rent, equipment depreciation, staff salaries) are not variable costs. They exist regardless of whether you run one case or ten.
Key Cost Drivers to Model for Every Arch Case
- Lab fees: The single largest variable cost. Ranges from $1,800-$3,200 (acrylic/PMMA) to $6,000-$12,000+ (monolithic zirconia) per arch. Your lab relationship and volume directly affect this number.
- Implant hardware: Four-implant systems (Nobel Active, Straumann BLX, Zimmer TSV) typically range from $400-$600 per fixture at volume pricing. Total hardware: $1,600-$2,400 per arch.
- Surgical and chair time: Includes surgical supplies, sedation materials, and the opportunity cost of doctor time. Estimate $600-$1,200 per arch depending on your model.
- Treatment coordination and staffing: TC compensation aligned to collections, not hours. Budget $500-$800 per arch for a properly structured TC model.
- Marketing cost per acquired case (CAC): Total implant marketing spend ÷ cases booked. In competitive markets, full-arch CAC runs $1,500-$3,500 per case. Most practices underestimate this number, which causes it to erode margin invisibly.
Why a $1,000 Price Change Matters at Scale
TIE model: At 60 arch cases per year, a reasonable target for a practice running a structured full-arch program, a $1,000 increase in per-arch price with no change in variable costs generates $60,000 in additional annual contribution. At $2,000 above current pricing, that number is $120,000. Pricing decisions are not monthly line items. They are annual P&L events.
Table 4: Sample Per-Arch Contribution Margin Model
| Line Item | Example Amount | Notes |
| Revenue per arch | $27,000 | Adjust to your actual price |
| Lab fees (hybrid prosthesis) | ($4,200) | Varies by material and lab relationship |
| Implant hardware (4 fixtures) | ($1,800) | Nobel Active example; varies by system |
| Surgical supplies + sedation | ($900) | Includes materials; excludes fixed doctor time |
| TC coordination cost | ($650) | Collections-aligned compensation model |
| Marketing CAC | ($2,100) | Total implant ad spend ÷ cases booked |
| Contribution Margin | $17,350 | Before fixed overhead allocation |
| CM % | 64.3% | Target range: 60-70% for full-arch programs |
All figures are examples. Model your numbers using your actual lab fees, system cost, and measured CAC.
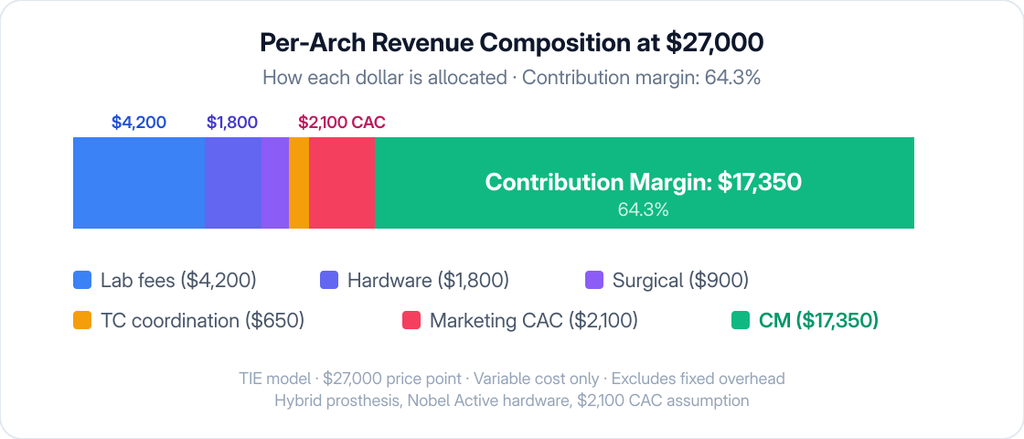
Per-Arch Revenue Composition at $27,000 — Contribution Margin: $17,350 (64.3%). Source: TIE internal model, 2026.
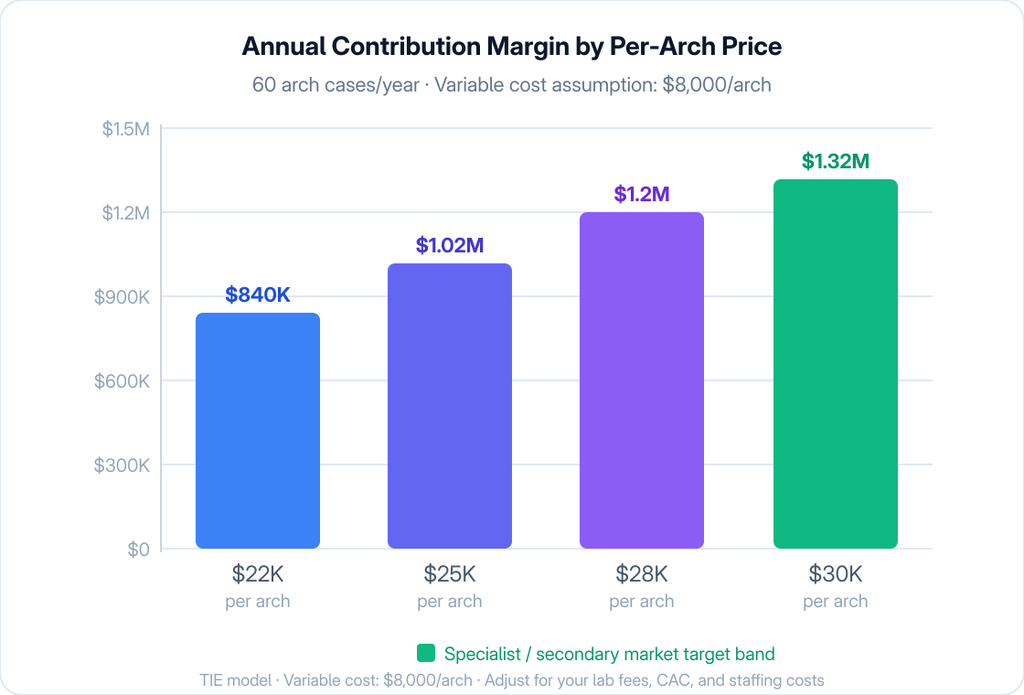
Annual Contribution Margin by Per-Arch Price (60 cases/year, $8K variable cost). Source: TIE internal client data, 2026.
Packaging vs. À-La-Carte Pricing
À-la-carte pricing invites objections. When patients can see individual line items such as imaging, sedation, temporaries, and follow-up visits, they begin to evaluate each one.
“Do I really need the sedation upgrade?” becomes the question instead of “which package fits my situation?”
That is a fundamentally different consultation conversation.
Bundled packaging solves this. It shifts the patient’s decision from “how do I reduce this list” to “which tier is right for me?” Three tiers. Not ten.
Table 5: Good / Better / Best Per-Arch Packaging (Example)
| Good | Better | Best | |
| Price | $24,000-$26,000 | $26,000-$29,000 | $29,000-$34,000 |
| Prosthetic material | Acrylic/PMMA | Hybrid (metal-reinforced acrylic) | Monolithic zirconia |
| Sedation | Oral/nitrous | Oral + IV option | IV sedation included |
| Temporaries | Standard acrylic temps | Enhanced temps | Custom aesthetic temporaries |
| Warranty | 1-year prosthetic warranty | 3-year warranty | 5-year warranty + annual review |
| Follow-up cadence | 1-week, 3-month, 6-month | All above + 12-month | All above + quarterly check-ins |
| Coordination model | Standard scheduling | Priority scheduling | Dedicated coordinator + direct line |
| Best for | Budget-conscious; functional focus | Most patients; best value-to-quality balance | Premium outcome seekers; high-value patients |
Always-included list (post at every location where pricing is displayed):
- Comprehensive CBCT imaging and digital treatment planning
- Four implant fixtures (premium-tier systems)
- Surgery and immediate temporaries on surgery day
- All post-operative follow-up visits as specified per tier
- Warranty as specified per tier
This list prevents the bait-and-switch perception that destroys trust when patients discover add-ons at checkout.
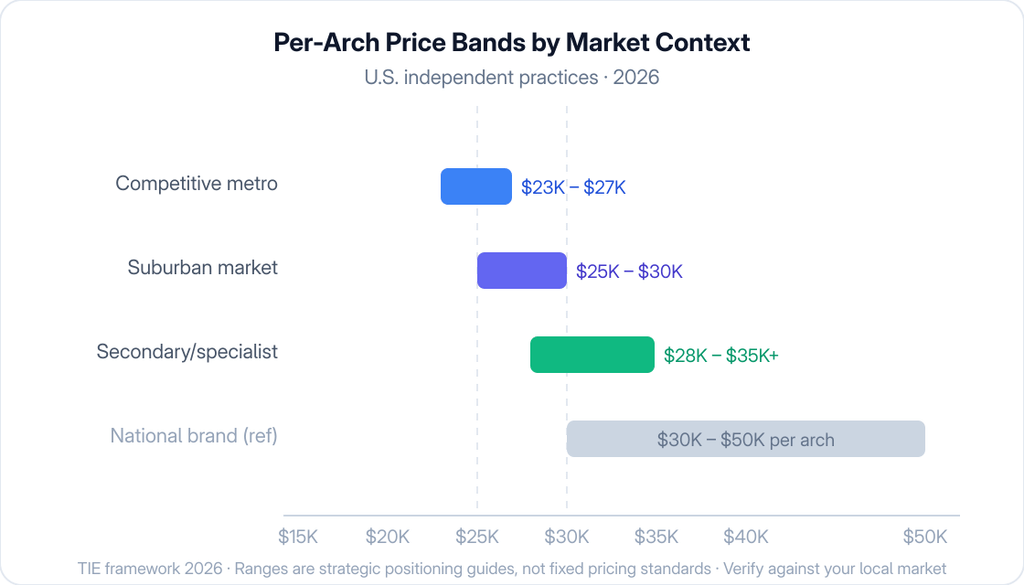
Per-Arch Price Bands by Market Context — U.S. independent practices, 2026. Source: TIE market framework.
Ready to Test Your Pricing Against Your Local Market?
Our team benchmarks your competitive set and shows you exactly where your current price sits, and what a $2,000 per-arch adjustment means for your annual P&L.
→ Get a Full-Arch Pricing Estimate: https://theimplantengine.com/contact
How to Communicate Value Without Defending Price
When patients ask “why is it that much?”, the wrong answer is a line-item justification. The right answer is a quiet, confident explanation of what they are actually buying.
A practice that has priced correctly does not apologize for its number. It anchors outcomes and expertise first, then names the price as the investment required to receive that standard of care.
When a patient says “I saw cheaper near me,” they are not rejecting your price. They are asking you to explain your value.
The 30-Second Price Explanation
A treatment coordinator should be able to say, calmly with no defensive register, something like this:
Script: “Our full-arch price of $[X] covers everything from surgery day through your final restoration: imaging, sedation, your temporary teeth, and your permanent [zirconia/hybrid] prosthesis. We include a [Y]-year warranty and [Z] follow-up visits. Dr. [Name] has placed over [N] full-arch cases. This is the one procedure we do not recommend cutting corners on, and our price reflects that.”
That is not a pitch. It is an explanation. The patient hears confidence, specificity, and a practitioner who has clearly thought this through.
Objection Responses
“I saw cheaper near me.”
“I am glad you are comparing. Can you ask them what is included? Specifically: does the price include imaging, sedation, your temporaries, and your final teeth, or are those separate? Once you have their all-in number, call us back and we will walk through the comparison together. We are completely transparent about what our price covers.”
“ClearChoice quoted me [X]. Why are you different?”
“ClearChoice is a useful reference. Their model is built around a national center with an in-house lab. We operate differently. Dr. [Name] is a [specialist/advanced-trained GP] who has placed over [N] full-arch cases, and we work with [lab name/material pathway]. Our price reflects our system, not a national chain’s overhead model. Many patients find they prefer the relationship with a local practice, especially for the follow-up care.”
“What is actually included?”
This question should never require improvisation. Every TC should have the inclusions list memorized and a written version to hand or send immediately. If your team hesitates here, that is the only fix needed.
Minimum Viable Pricing Threshold
There is a floor below which full-arch pricing ceases to support a sustainable clinical program. That floor is not a competitor’s website number. It is your own cost structure.
Your price must support, at minimum:
- Quality materials: The prosthetic system that produces the outcomes you promise
- Experienced staff: TC compensation, surgical assistant, and post-operative support at appropriate levels
- Consistent marketing investment: Full-arch programs require ongoing paid media; cases do not appear organically at scale in competitive markets
- Predictable outcomes: The follow-up protocol, the warranty fulfillment, the CBCT and planning that reduce surgical variability
If your current price cannot fund all four, the price is not market-rate. It is unsustainable. And unsustainable pricing does not become sustainable by adding more volume. It becomes a faster version of the same problem.
Fix focus: Run the contribution margin model in Table 4 against your actual numbers. If your CM falls below 55-60% on a full-arch case, your price, your variable costs, or both require adjustment before volume scaling.
Frequently Asked Questions
How much do All-on-4 dental implants cost per arch?
In the U.S. in 2026, All-on-4 dental implants cost between $20,000 and $40,000 per arch, with most quality independent practices targeting $25,000-$30,000. The variation reflects geography, material choice, and what is included in the quoted price.
How much do full-arch implants cost for both arches?
A full-mouth restoration (both upper and lower arches) typically costs $40,000-$80,000 in the U.S. Many practices offer a two-arch discount of $3,000-$8,000 off the second arch. As with single-arch pricing, confirm all inclusions before comparing quotes from different providers.
What is typically included in a full-arch price?
A transparent, all-in full-arch price includes: comprehensive CBCT imaging, digital treatment planning, four implant fixtures, sedation, immediate temporaries at surgery, all healing and follow-up visits through final delivery, and the final prosthesis with warranty. Any of these as an add-on is a cost the patient discovers later, which creates trust damage at the worst possible moment.
Why does “dental implant cost near me” vary so much?
Five factors drive most of the variation: geography (major metros carry a 20-50% premium), material selection (acrylic vs. zirconia), sedation model (oral vs. IV), inclusions (imaging, temps, and warranty vary widely), and provider type. Two practices quoting $26,000 may be offering meaningfully different procedures.
How does ClearChoice pricing compare to local practices?
ClearChoice typically prices full-arch treatment at $30,000-$50,000 per arch, reflecting their in-house lab, bundled model, and national brand overhead. Independent practices with equivalent or superior clinical systems typically price 25-40% below ClearChoice while offering more personalized care and direct provider access.
Is “affordable full arch implants” a red flag?
Often. Low-price positioning in full-arch implantology frequently reflects corner-cutting on materials, sedation, follow-up protocol, or staff training. Patients who make a $25,000+ irreversible surgical decision based primarily on price are the most likely to experience complications from under-resourced treatment.
What should a practice charge for full-arch implants in a competitive market?
In a highly competitive metro market, ~$25,000 per arch is a defensible starting point with a strong offer structure. In suburban and secondary markets, $26,000-$30,000+ is achievable with the right positioning. The right number is whatever your market sustains while producing a contribution margin of 60-70% per arch after all variable costs, including your true marketing CAC.
Is it ever smart to price below ~$25K per arch?
Rarely. In most U.S. markets, sub-$25,000 per-arch pricing is not necessary to be competitive if your offer is clear and your differentiation is communicated. Practices that price below this threshold typically do so because they cannot articulate their value, not because their market requires it.
The Three-Step Framework and Your Next Move
Profitable full-arch pricing requires three things done in the right order:
- Benchmark offers, not prices: Mystery shop your local competitive set. Capture inclusions, warranties, sedation model, and materials. Understand the offer before you set a number.
- Choose your positioning: Value (better than national brands at a lower price) or premium (specialist-led, advanced systems, documented outcomes at a higher price). Both are defensible. The middle, premium price without premium positioning, is not.
- Price to contribution margin + CAC: Run your numbers. Set a price that produces 60-70% CM after lab fees, hardware, staffing, and your real marketing cost per case. Then price $1,000-$2,000 above that floor to protect against cost increases.
From TIE practice data: The practices that execute this framework consistently (clear competitive benchmarking, strong offer structure, and contribution margin discipline) reach 5-10+ full-arch cases per month reliably. Star Dental, a TIE client, generated $636,798 in implant revenue from $33,133 in ad spend over five months. That level of ROI is not possible at unsustainable price points.
The global dental implants market is growing at 9.02% annually (Grand View Research, 2025). The practices that build confident pricing systems now are the ones positioned to capture that growth. The ones that compete on price alone are the ones funding everyone else’s acquisition costs.
In 30 minutes, TIE’s team benchmarks your market, models your contribution margin, and shows you what a $2,000 per-arch adjustment means for your annual revenue. No obligation. No pitch. Just the numbers.
→ Book Your Free Strategy Call: https://theimplantengine.com/contact
Prefer to Start With Data?
We pull your market’s competitive set, document their offer structures, and deliver a custom report you can use to price with confidence.
→ Request a Local Pricing Benchmark Report: https://theimplantengine.com/contact